Introduction to Data Visualization
Introduction
This material gives an introduction to Data Visualization in Python for Beginners.
For more details you can consult the following reference materials:
Codes are given in this tutorial. You can copy and paste them on your pc.
Install Anaconda on your Laptop. For details on how to install anaconda see here
Data Science and Data Visualization
This is the science of extracting and exploring data in order to find patterns that can be used to make decisions in organizations.
This is a subdomain of data science where you visualize data with the help of graphs and tables in order to identify important patterns.
Visualizing data graphically can reveal trends that otherwise may be hidden from the naked eye of a person.
Data visualization is a step to important processes such as:
- Data Science
- Machine Learning
- Business Intelligence
- Data Analytics
Data Visualization is one of the important skill sets of this century if you want to secure a data science job
Please you can watch this video on A Data Scientists Perspective of the importance of data visualization to data science
Writing Your First Program
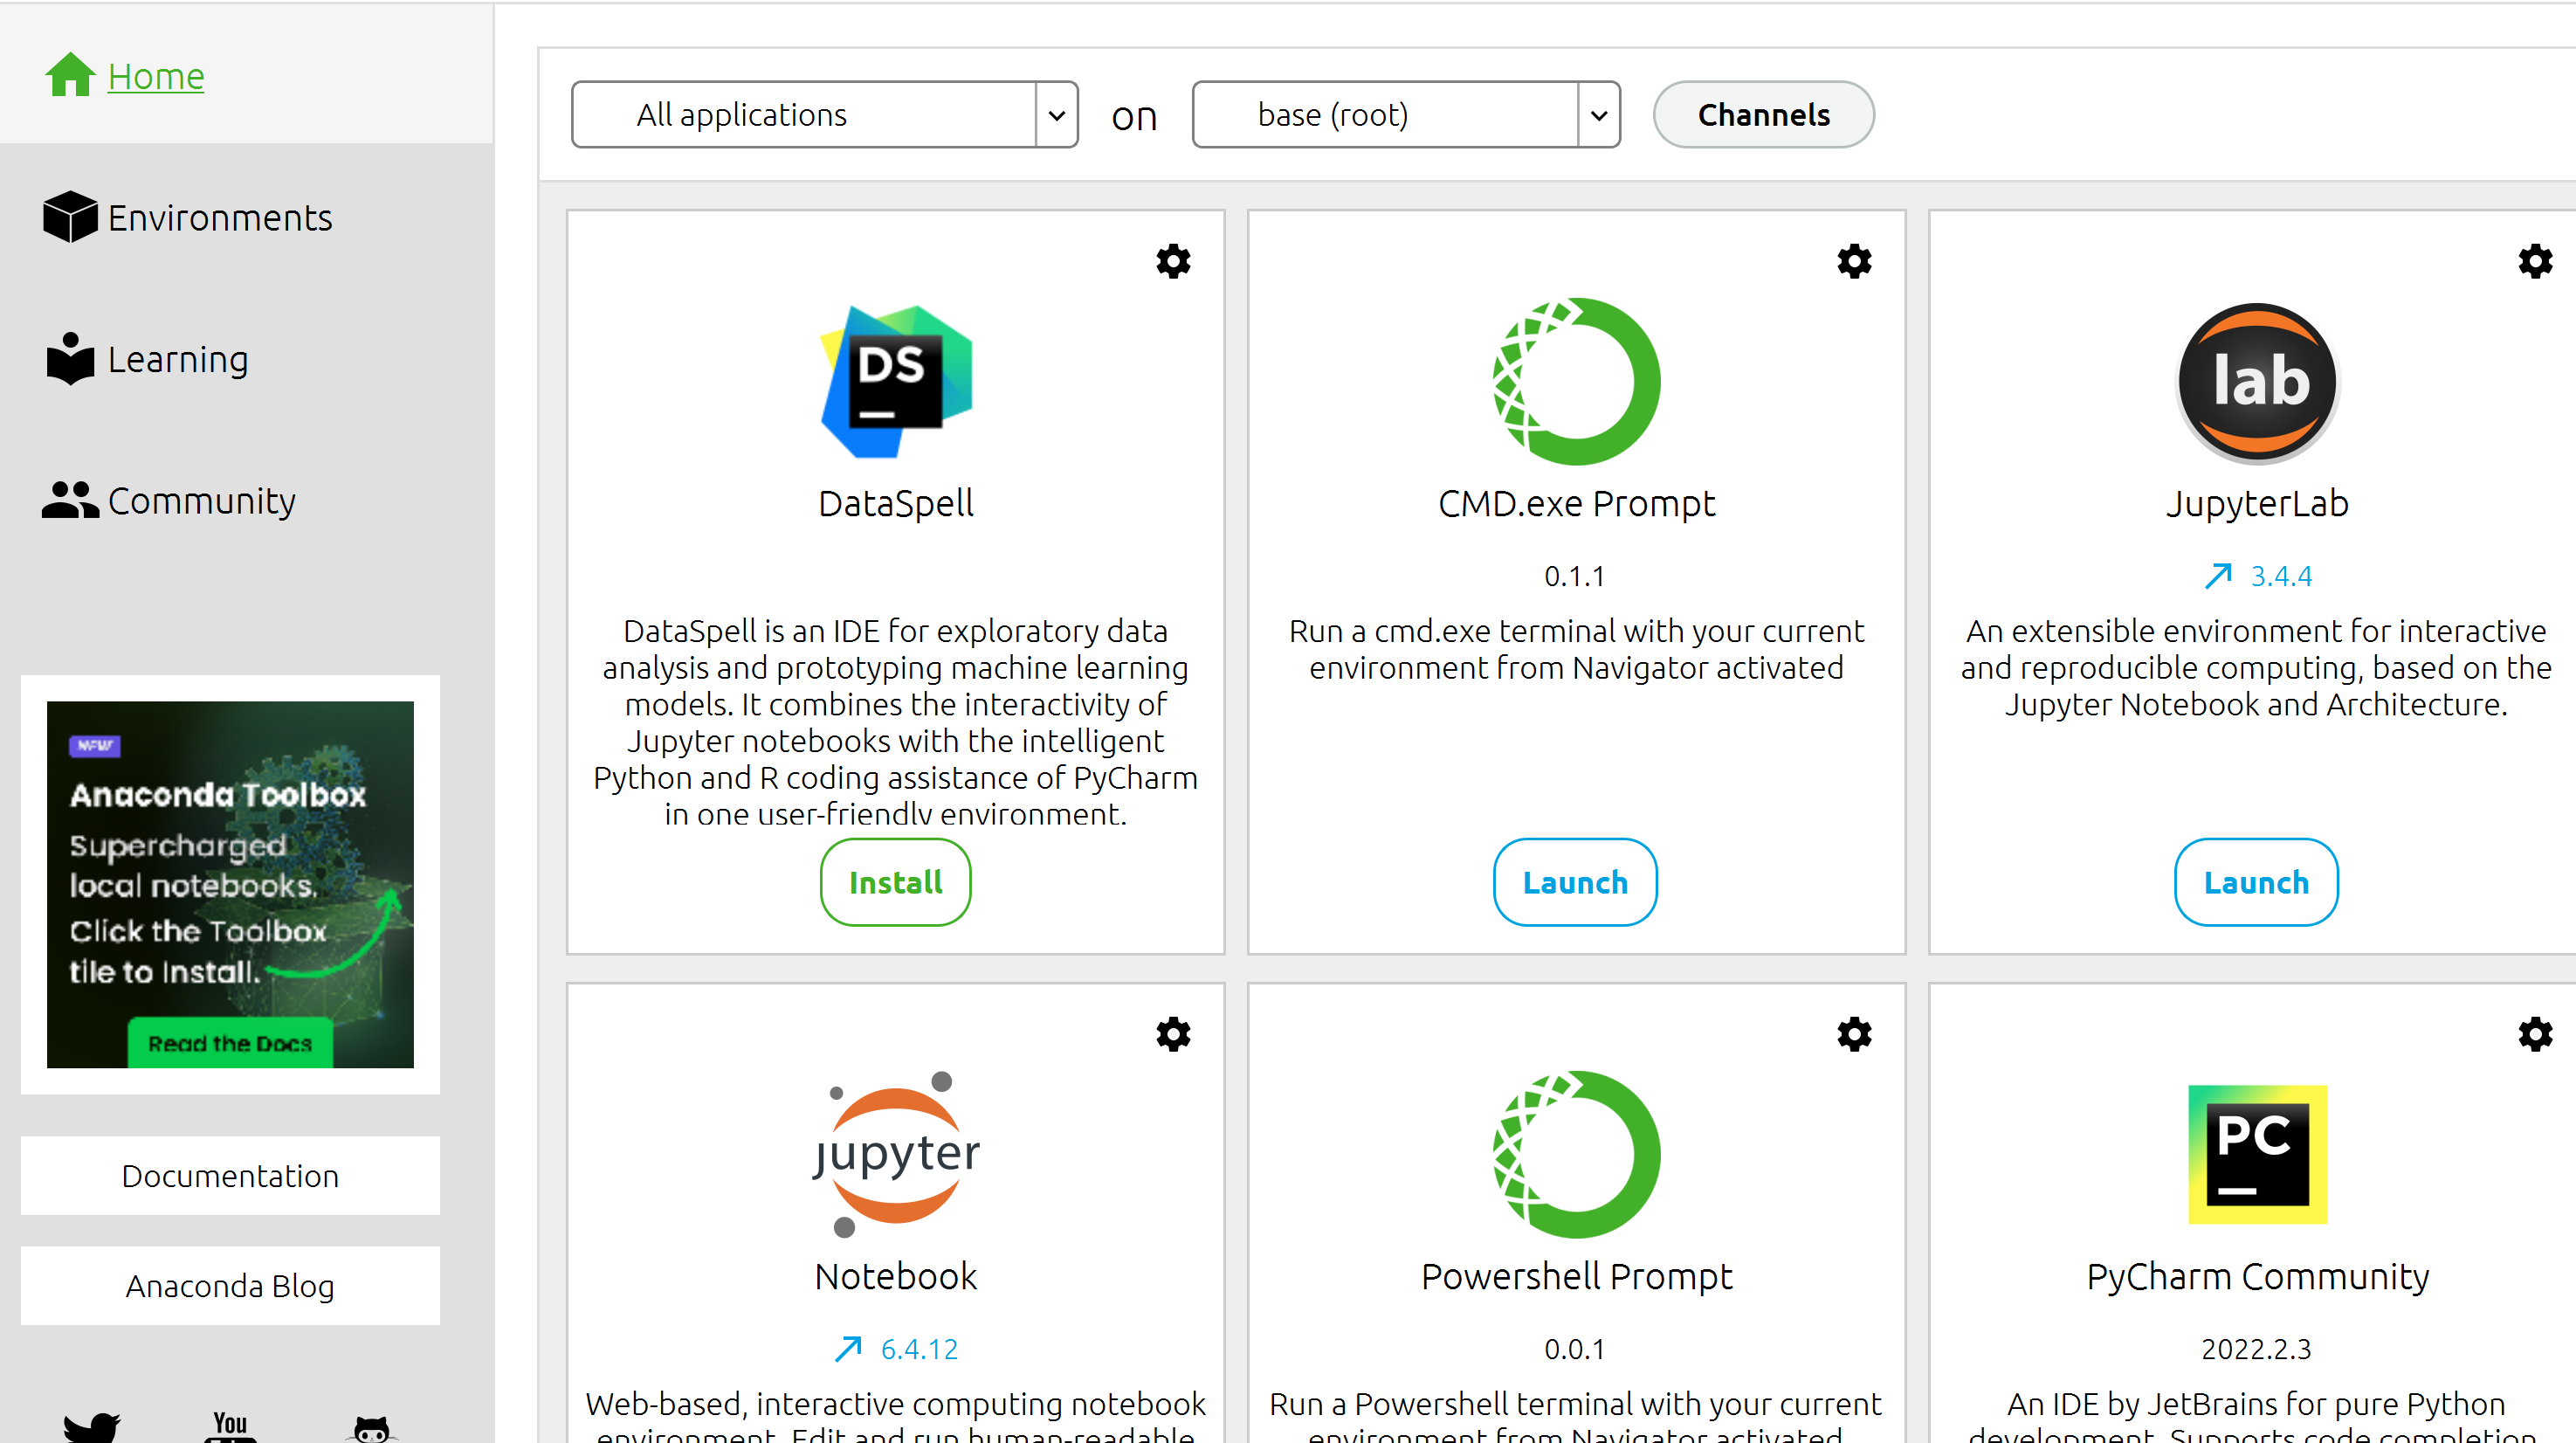
In order to write a program in Anaconda, you have to launch Anaconda Navigator.
Search Anaconda Navigator in your Windows Search Box. Once you click on the application the Anaconda’s dashboard will open.
We will use the Jupyter Notebook in this resource.
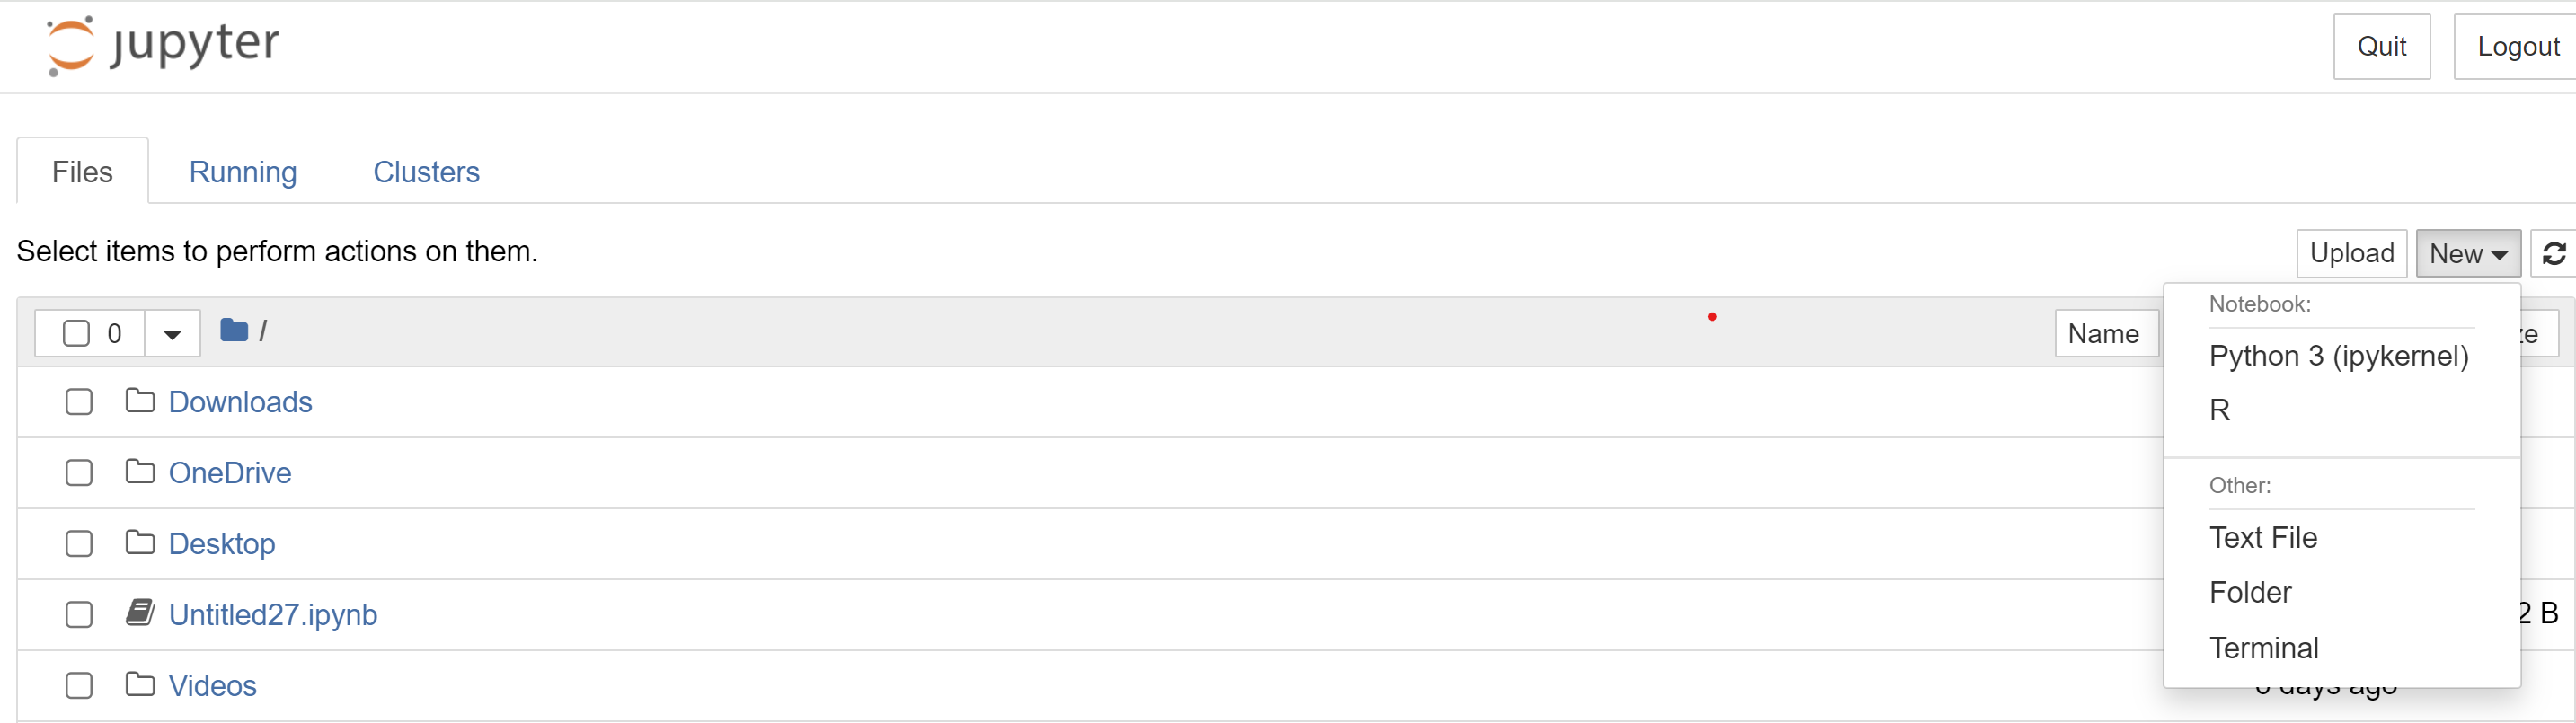
The top right corner of Jupyter Notebook’s own dashboard houses a New button, you have to click to open a new document. From the dropdown that has several options click on Python 3.
A new Jupyter Notebook will appear that looks like this
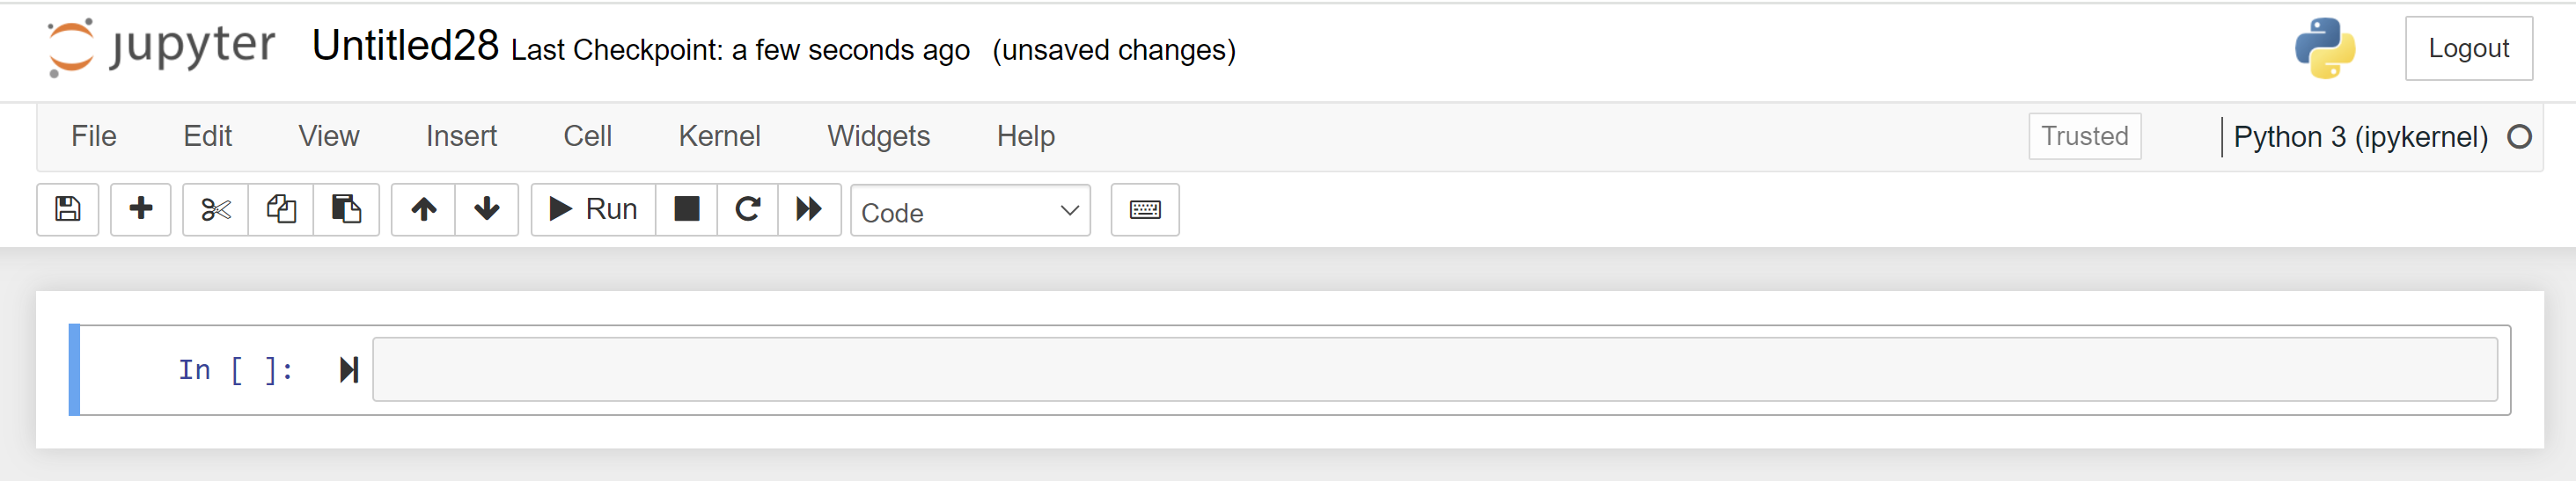
The Jupyter Notebook consists of cells that makes its layout very simple and straightforward.
We can write our first program as:
print("Welcome to Data Visualization with Python")Important Requirements: Anaconda, Jupyter, Matplotlib
All the scripts in this tutorial are written in Jupyter Notebook
We will explore the following visualization modules:
- Matplotlib
- Seaborn
- Pandas
- Plotly
To install a python library use the following in a Jupyter Notebook cell
# install pandas library

!pip install pandas
To load any Python library use
# loading library

import pandas as pd
Python Variables and Data Types
In a programming language data types refers to the type of data that the language is capable of processing.
In Python the major data types supported include:
- Strings
- Integers
- Floating Point Numbers
- Booleans
- Lists
- Tuples
- Dictionaries
For more details see Crash Course in Python
Data Visualization Libraries
Matplotlib is the default static data visualization in Python.
Many wrappers libraries like Pandas and Seaborn have been developed on top of Matplolib
This library is built on top of the Matplotlib library and contains all the plotting capabilities of Matplotlib.
This is an extension of the Matplotlib and is used for plotting Geographical Maps in Python
Pandas library, like Seaborn, is based on the Matplotlib library and offers utilities that can be used to plot different types of static plots in a single line of codes.
Plotly is an online data visualization platform that supports interactive data visualization. More will be explored.
A good visualization:
- Communicates a piece of complex information in a simple, clear and concise manner to top business leaders
- Enables users focus on actionable insights
- Provides insights and story to establish business goals by giving attention to unnoticed patterns
- Helps businesses make real-time decisions